| Appearance |
Description |
 |
The main chart
It is the main chart, with lines or columns of the dashboard, that contains the following data:
API:
- API Usage version 1.
- API Usage version 2.
Advertising:
- Count of Clicks;
- Count of Impressions;
- Value of the Clicks;
- Value of the Impressions
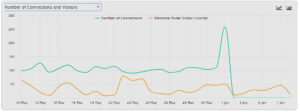
Connections
- Average Sessions Time (in minutes);
- Hours of Connection and Visitors;
- Count of Connections and Visitors;
- Count of Visitors per Minute (last 24 hours)
- Weekly Connections;
- Peak Daily Connections on an Hourly Basis (it displays the peak of the connections performed in the day during one hour time)
- Welcome Portal Visitors on an Hourly Basis
Data (MBytes)
- Download and Upload Data.
- Download and Upload Average Data per device.
- Download and Upload Average Data per user.
Sales
- Daily Sales.
- Daily sales for advertising campaigns.
System
- CPU usage in the last 24 hours, every minute, every 5 minutes and every 30 minutes (visible only for users who have an administrative role);
- Ethernet Data Rate (visible only for users who have an Administrative role)
- RAM and SWAP used in the last twenty-four hours (visible only for users who have an Administrative role);
Family DNS
- Family DNS Queries (Last 24 Hours);
- Family DNS Times (ms) (Last 24 Hours);
- Family DNS Cache Size (Last 24 Hours).
Surveys
- New Surveys,
- Average Score (sum of the score obtained from all the answers and divided by the number of completed surveys);
- Score for Question of the Surveys;
- Value for Question of the Surveys, Quizzes or tests.
Users
- Concurrent Users and Devices in the Last 7 days;
- Unique Connected Users;
- New Registered Users and Returning Users;
- Social Network New Registered Users;
- Amazon New Registered Users
- Facebook New Registered Users;
- Google New Registered Users;
- Instagram New Registered Users;
- LDAP New Registered Users
- Google New Registered Users;
- LinkedIn New Registered Users;
- Twitter New Registered Users.
- VKontakte New Registered Users
Gateways (just for MiktroTik)
- CPU used by the gateway
- Data Rate
- Latency to Google (ms);
- Latency to Wi5stars (ms)
Access Points (just for MikroTik)
Latency from the Gateway.
The chart type can be selected by pressing the or buttons.
Instagram has been maintained for compatibility with previous versions where it was still possible to log in with this social network
|
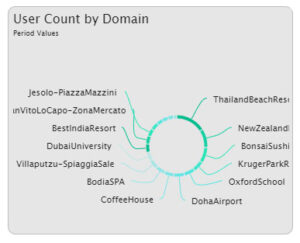 |
Count of users per domain
Graph that shows the top 20 domains with multiple users. By clicking on a description of the domain or on the part of the chart, the party concerned will be exploded.
|
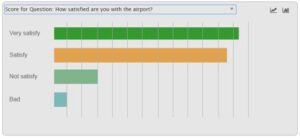 |
On the dashboard of the surveys, quizzes or tests, it counts the responses for every single question.
|
| Users |
Count of users connected
The value is automatically updated every five minutes.
|
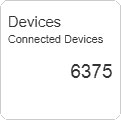 |
Count of devices connected
The value is automatically updated every five minutes.
|
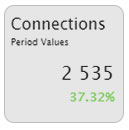 |
Connections
Count of user connections of the HGWs and PGWs in the selected period and per cent trend compared to the same count of days preceding the period’s start date.
The value is updated every four hours, in order to avoid heavy queries to the database that might slow down the system.
|
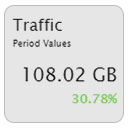 |
Traffic
Download and upload traffic generated by users of the HGWs and PGWs in the selected period and per cent trend compared to the same count of days preceding the period’s start date.
The value is updated every four hours, to avoid heavy queries to the database that might slow down the system.
|
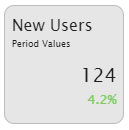 |
New users
New users registered in the selected period and per cent trend compared to the same count of days that precede the period’s start date.
|
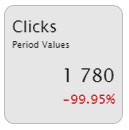 |
Clicks
Count of clicks from users of HGWs, on videos, Ad banners or injection in the selected period and per cent trend compared to the same count of days that precede the period’s start date.
|
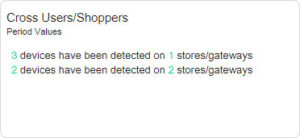 |
Users/Customers on multiple gateways
Summarize the count of unique devices that are connected to one or multiple gateways.
The values indicate in practice the count of users who visit multiple locations/shops.
|
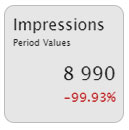 |
Impressions
Count of views advertising campaigns carried out by users of HGW over the last thirty days and trend percentage compared to 30 days before.
|
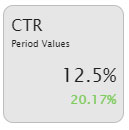 |
Clicks Through Rate
The percentage ratio is derived from the count of impressions and clicks for advertising campaigns in the selected period and per cent trend compared to the same count of days that precede the period’s start date.
|
|
Amount of not Activated Cards
|
Amount of sales generated by cards not yet activated.
|
|
Amount of not Activated Vouchers
|
Amount of sales generated by vouchers not yet activated.
|
|
Sales from other methods
|
Amount of sales generated by payments made through payment gateways, assigned by the backend, etc.
|
 |
Total Sales
Represents the sales amount during the selected period and per cent trend compared to the same count of days that precede the period’s start date.
The value includes sales through payment systems and activated vouchers.
|
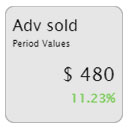 |
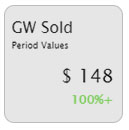
Advertising Sold
Value of purchases made by managers or advertisers to fund advertising campaigns in the selected period and per cent trend compared to the same count of days preceding the period’s start date.
|
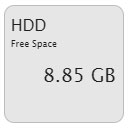 |
Free/Total HDD
Free and total hard disk space for data.
If the colour of the text is orange, then the free space is less than 10 GByte.
If the colour of the text is red, then the free space is less than 5 GByte.
Warning! With little space available for data, there may be problems in database data, backups, restores, saving user traffic logs, etc.
Real-time value.
|
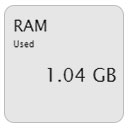 |
RAM
RAM used.
Real-time value.
|
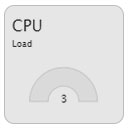 |
CPU
CPU load average.
Real-time value.
|
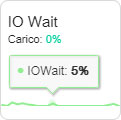 |
IO Wait
IO Wait is a CPU metric which measures the percentage of time the CPU is idle but waits for I/O to complete.
A high value indicates that there are probably disk saturation problems.
|
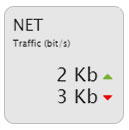 |
NET
Network traffic in upload and download.
Real-time value.
In the reseller dashboard, it represents the total traffic of the network interface card and not specific.
In the PPPoE user dashboard, it displays the user data rate.
|
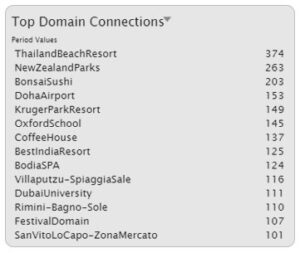 |
Top Domain Connections
It contains the following information depending on the value selected in the title:
- Domains with multiple connections: it lists the first fourteen domains that generate the highest number of connections. Mousing over the rows, it displays the trend percentage compared to the same number of days that precede the period’s start date.
- Connections per day of the week: it shows the number of connections per day of the week. As for the previous value, by mousing over the rows, you are displayed the trend percentage on the week calculated in base on the same period of days that precede the starting date of the period.
Warning! The data per day of the week reproduced on a compressed period (in base to the value defined in “System Settings” in the “Keep detailed Logs for” field) are not correct because they are grouped.
|
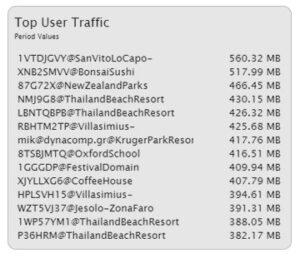 |
Users with the most traffic
Reproduces a list of the first fourteen users who generated the most traffic. Scrolling with the mouse over the rows, the trend percentage appears compared to the same count of days that precede the period’s start date.
|
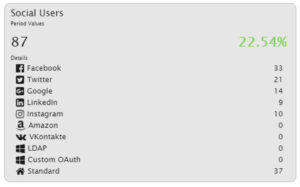 |
Social Users
Shows the total count of users who have been registered using social networks in the selected period and the total percentage trend compared to the same count of days that precede the start date of the period.
In the details are shown the number of users who have been registered for each social network in the selected period. Scrolling with the mouse over the rows, you are displayed the trend percentage compared to the same number of days preceding the period’s start date.
|
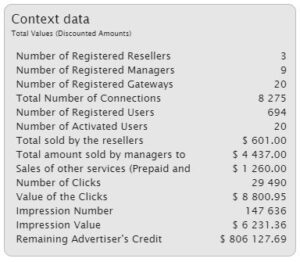 |
Context data
The tile data content depends on how the dashboard is visualised. It displays a list of information on the system, resellers, managers, domains, users, advertisers, and campaigns.
|
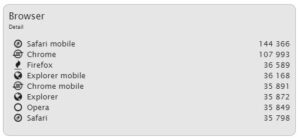 |
Browser
Reproduces the list of the first fourteen types of browsers used by the users.
|
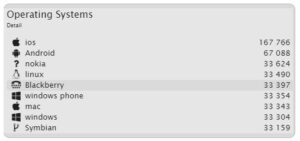 |
Operating systems
Reproduces the list of the first fourteen types of operating systems used by the users.
|
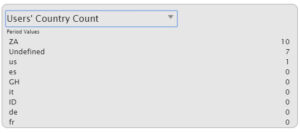 |
Count of the number of users per grouping of the selected period.
It allows you to count the number of users grouped by ZIP; City; country; gender; year of birth; language.
When you scroll the mouse over the lines, you are displayed the percentage trend compared to the same count of days preceding the period’s start date.
|
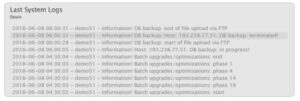 |
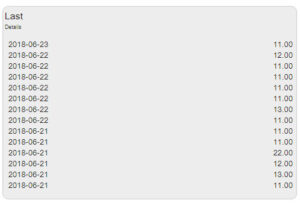
The last system logs
Shows the date, time and description of the last system logs.
|
| |
Map
Map of gateways and/or access points.
|
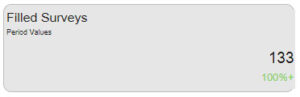 |
Filled out surveys, quizzes or tests
The count of surveys filled out by users of the HGW in the selected period and trend percentage compared to the same count of days before the period’s start date.
|
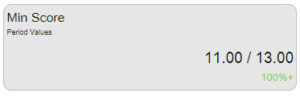 |
Minimum score of the survey, quiz or test
The minimum score obtained from users’ responses of the HGW compared with the maximum score of the survey for the selected period and trend percentage compared to the same count of days before the period’s start date.
|
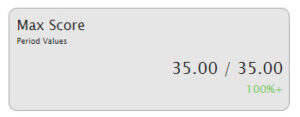 |
Maximum score of the survey, quiz or test
The maximum score obtained from users’ responses of the HGW compared with the maximum score of the survey for the selected period and trend percentage compared to the same count of days before the period’s start date.
|
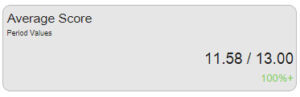 |
Average score of the survey, quiz or test
Average score from users’ responses of the HGW compared with the maximum score of the survey for the selected period and trend percentage compared to the same count of days before the period’s start date.
|
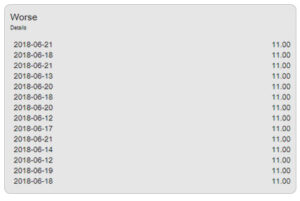 |
List of the worst results of surveys, quizzes or tests
List of the worst fourteen surveys, quizzes or tests with their score sorted in ascending order.
|
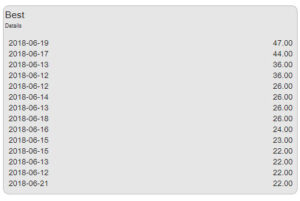 |
List of the best results of surveys, quizzes or tests
List of the top fourteen surveys, quizzes or tests with their score ranked in descending order. List of the best surveys, quizzes, o tests.
|
 |
List of the last fourteen filled-out surveys, quizzes or tests
List of the last fourteen surveys, quizzes or tests filled out by the users of HGW with their scores.
|
| |
Family DNS: Queries
Displays the number of queries to the Family DNS received during the last 24 hours.
|
| |
Family DNS: Blocked
Displays the count of queries blocked by the Family DNS during the last 24 hours as a result of the filters defined in the System Settings.
|
| |
Family DNS: from Cache
Displays the count of cache responses sent by the Family DNS during the last 24 hours. |
| |
Family DNS: Blacklisted
Displays the count of queries blocked by the Family DNS during the last 24 hours due to the blacklists enabled.
|
| |
Family DNS: Response Time
Displays the average response time of the Family DNS over the last 24 hours.
|
| |
Family DNS: Cached Domains
Displays the maximum peak of the Family DNS cached domains during the last 24 hours.
|